 My Clinic is in the United States
 My Clinic is in Canada
Find out more about preimplantation genetic testing for aneuploidy with our Vice President of Global Genomics Business Development, Tony Gordon PhD. Speaking at a live event in London, he covers what PGT-A is designed for, its history and development, how it works, and its rate of success.

The Past and Present of PGT-A
In this presentation, our Vice President of Global Genomics Business Development, Tony Gordon PhD discusses preimplantation genetic testing for aneuploidy. Speaking at a live event in London, he covers what PGT-A is designed for, its history and development, how it works, and its rate of success.
In this talk, I’ll give you a little bit about PGT-A’s past and then give you a little bit about what we’re doing right now. We also had our annual PGT conference just a couple of weeks ago in Geneva which was a good way to get some of the latest data, so I’ll present some of that. Later, if you guys are still awake, I’ll do a little bit of crystal ball gazing, looking at where we might be in the future and trying not to scare you about where genetics could go!
The thing that I’m going to talk about is the aneuploidy screening, PGT-A, because that’s actually where things are developing at the moment. PGT-M – the monogenic disease testing – is not really something I’m going to talk about.
What is PGT-A
PGT-A is chromosome screening; you’re counting embryos for the right numbers of chromosomes – that’s the simplest way of thinking about it. The premise is simple; if you have an embryo with the right number of chromosomes it’s more likely to implant and result in a healthy live birth than one with the wrong number of chromosomes. How we get as much controversy as we do in the UK about that is a good question, but that’s the simple premise.
Is it an option for all IVF patients? Well, that’s certainly up for debate. Does it improve IVF success rates? I won’t really dwell on that too much because we could have a whole lecture about that – certainly, there are quite a lot of randomized control trials and papers that we can discuss.
So, it’s a genetic test aimed at improving IVF outcomes. What you have to remember is, it doesn’t improve embryos; all you’re doing is using a different way of selecting those embryos for transfer the first time. If you had a cohort of five embryos and you transferred every one in sequence, you would have the same outcome as if you transferred one and then did a selection, and then transferred the next one (except you’ll end up with multiple miscarriages and you might have a poor experience for the patient in between.) So, we’re trying to select the embryos first time that are most likely to result in healthy live birth.
It provides the patients with information about the chromosomal health (which is a bit of an American term I must say) of their embryos and hopefully it improves pregnancy outcomes.
History of PGT-A Development
I have been in this field for just over ten years and the field of PGT-A has been going since the early 90s. At that point, we used a technique called FISH, which was where you had to spread embryos and count chromosomes. It’s still used in oncology and it’s great for oncology, where you have hundreds of cells to count. But not when you have one cell to count.
About twenty years ago, we changed to another technique which was Metaphase CGH. This was a lovely technique if you’re a cytogeneticist like I am, where you painted DNA onto chromosomes. It was fantastic but it was also incredibly labor-intensive; you have to be an expert cytogeneticist and it was terrible to analyze, but it was it was the first time that we were able to look at all chromosomes, which is kind of interesting.
When I came into the field in 2008, working for a company called BlueGnome, our claim to fame was that we were the first people to be able to analyze a single cell and really count the chromosomes to a certain extent. We did our first single-cell case back in 2008 and that was the first time that anybody used a real, good counting technique for PGS.
And then we move on and things are speeding up. In 2014, we introduced Next Generation Sequencing. NGS has this great “Wow, we’re sequencing embryos for every base pair, isn’t it ‘Brave New World’?” [aura]. However, it’s not that at all and, without going into it in too much detail, it’s a really good way of counting chromosomes very accurately using DNA sequences. That has its flip side, because the more information you find, the more questions you find, and now we’ve got new questions that we must address regarding mosaicism.
How we’re changing things now is by using AI to improve our analysis. The aim of that is then to improve your outcomes for your patients.
The other thing, of course, is that we’ve moved from doing Polar Body and Day Three single cell analysis, to doing Day Five and vitrification. We used to do the Day Three biopsy and then next day results… absolute nightmare for the lab! But, importantly, you’ve gone from one cell to five-cell and, although it doesn’t sound very much, actually we can do a far better genetic test on five cells than we could on just a couple.
A couple of quick historical asides… I’m going to tell you about a few of these profiles.
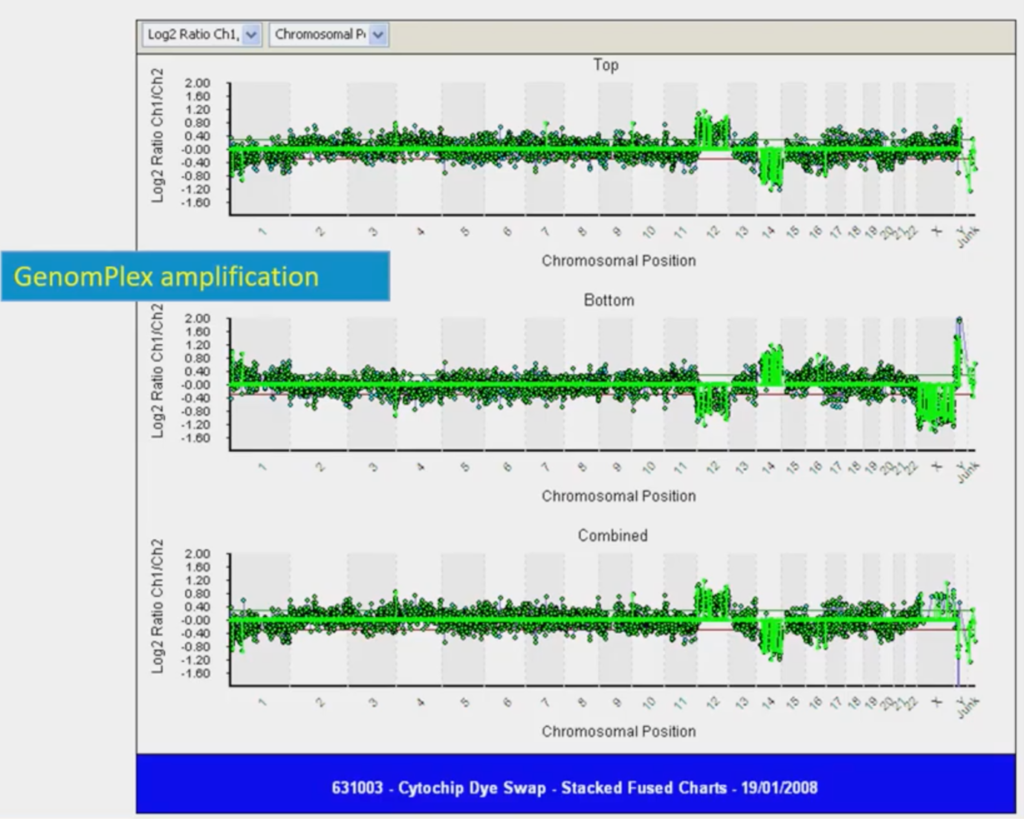
If you’ve never seen one before this is a linear view of a genome (this is data from 2008 so it’s ancient history in genomics terms!) Looking at the line in the middle; if it’s in the middle you have two copies of every chromosome, so that’s normal. If it goes above the line you have three copies of a chromosome, and below the line, one copy of a chromosome. So, above the line is a trisomy, below the line is a monosomy.
This was the first time that we got a single cell to show a gain and a loss. In this example, we have a trisomy twelve and a monosomy fourteen; if you squint you can see this. I went to the pub with this and showed my friends, saying “Look at this, it’s amazing!” and they thought “The boy’s lost it here!” But it was, I remember, a sort of seminal moment.
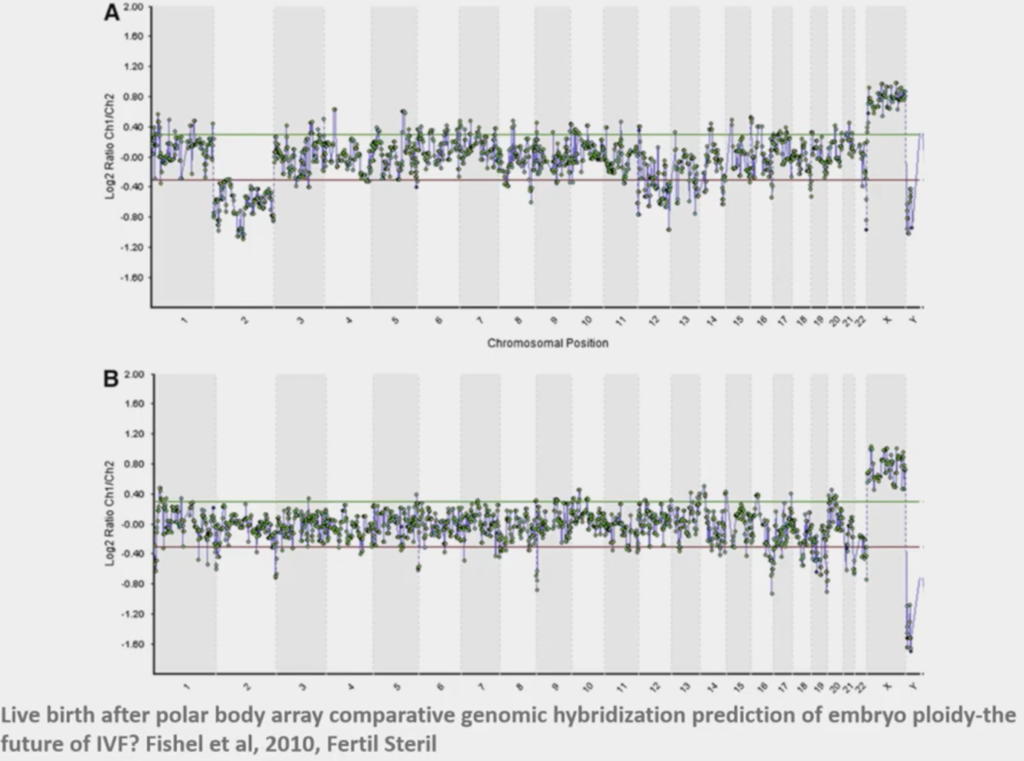
When we first started doing this, Polar Bodies was what we thought was the least invasive thing to work on. This above was the very first case that we did with CARE Fertility and this was a lady who had had 14 previous failed IVF cycles, so it was ‘last chance saloon’! We now look back upon it and wonder, ‘How did we really call this?’ This particular embryo was the only one out of eight embryos that was normal; she transferred that, and she ended up with a little boy, baby Oliver.
At that point we had N=1 experiment and we thought ‘this is the way’! You always find out about it later on! But it was a really interesting time to be doing this kind of stuff.
The thing that really changed is the data that we get. Back in FISH, that was three data points; three chromosomes are what we were working on. Then we thought it was great when we got the seven chromosomes and then, finally, we got to 24 data points – 24 chromosomes – and that was really pushing the boundaries back in 2000. When PGT-A started? Three thousand data points!
When you’ve got more data points you can analyze things more extensively and we’re now about half a million data points from sequencing; that’s why we can count chromosomes much better. The only way this trend is going is towards more data. How you interpret it, how you use it and how it works in clinical practice is going to be the fun bit.
What didn’t we know back then that we know now?
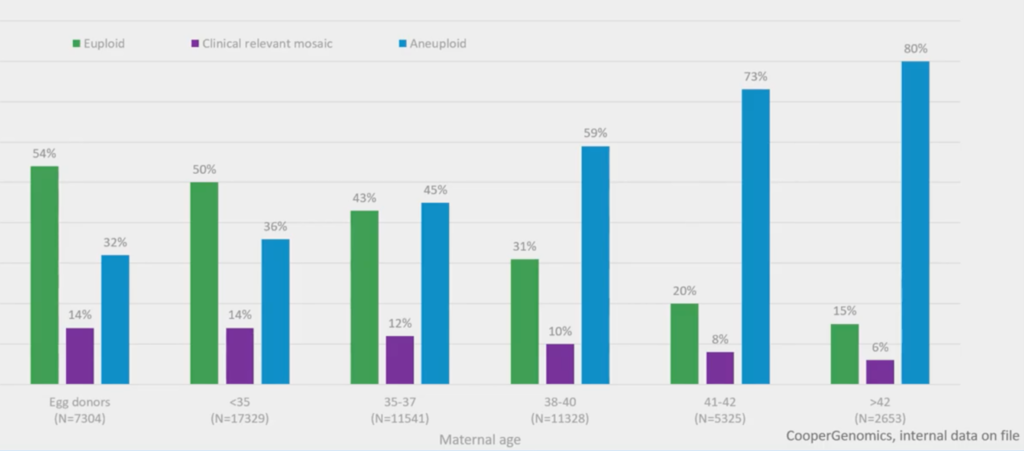
About 55,000 embryo biopsies were used to get this graph. It’s very simple and it shows euploid embryos (with maternal age) in green, aneuploid in blue and mosaics in purple.
It’s fairly obvious now – but it wasn’t, really, when we were doing this stuff back then – that, over the age of 36 and a half, more than 50% of embryos are aneuploid. So, it becomes a 50/50 chance, at that point, if you don’t do a selection of some sort. You might use time-lapse, you might use PGT-A; in the future you might use them both together.
The other thing – our new level of discovery to add things and make things a bit more difficult – is the purple, which is mosaics (which I’ll come on to later).
But, certainly, with advanced maternal age, your odds are becoming stacked, trying to find a euploid.
Present PGT-A Technology
So, what can we use it for now? What’s the technology? It tells us, really well, about aneuploidy.
There are two types of aneuploidy; there’s meiotic aneuploidy (that comes from the egg and sperm) and there’s post-mitotic (which comes from errors after fertilization).
The thing that we’re really good at, is meiotic aneuploidies. These are full chromosome changes and that’s why we do thousands of these and it’s incredibly rare when somebody rings us up and says, for instance, ‘we have had a miscarriage, and that miscarriage has a genetic trisomy’ and we didn’t see it. So, it has an extremely low false negative. That’s good.
It will detect parts of chromosomes that are gained or lost (segmental aneuploidies), translocations (for structural rearrangements), polyploidy (currently we can detect male polyploids – so that’s male triploids – and we’re working hard on being able to do full analysis of polyploidy) and then, the new one.
Like everything, you find some new technology and it brings you to new questions. Mosaicism is the question that it’s brought up, and I’ll tell you a little bit about how we’re using AI here.
PGT-A data and PGTai
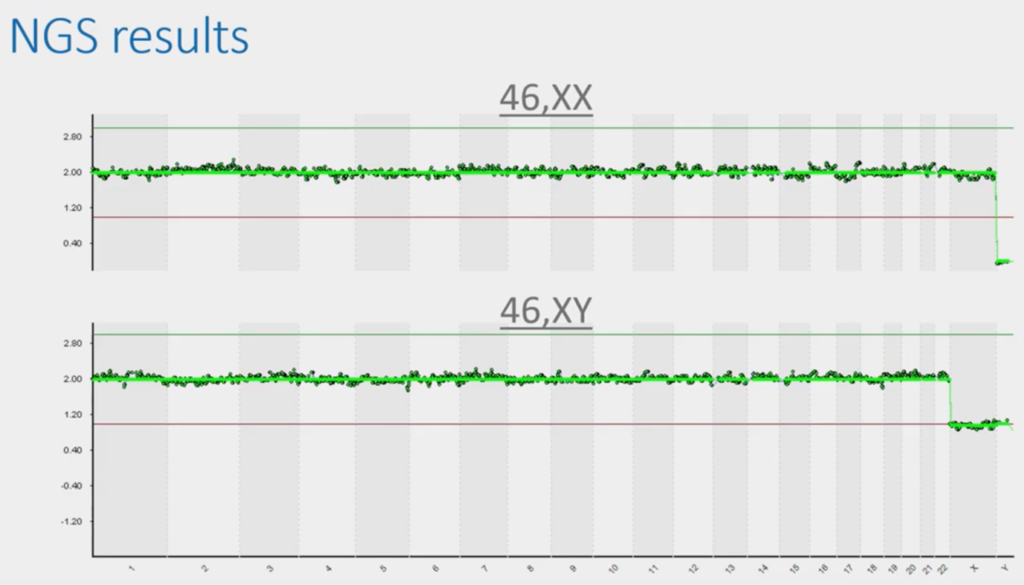
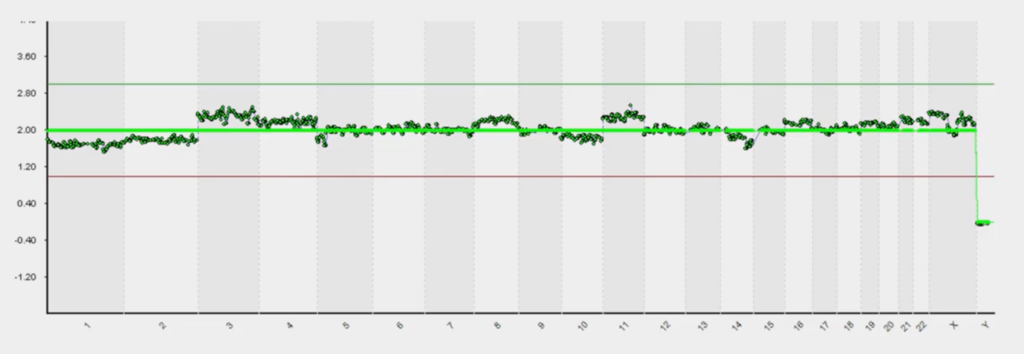
This is the typical presentation slide that people use in a talk on PGT because it’s beautiful and, with two minutes’ explanation is easily understood by a student coming out of university or coming out of college. If this, the dark green data, is in the middle, it’s two chromosomes; if it goes over the green line it’s three and touches the red line, one. So, you can tell that this top image is a normal female.
This bottom image, because it has one copy of X, one copy of Y, is a normal male. So, of course, in the UK we don’t tell you anything about this bit (unless there’s a sex chromosomal abnormality) but we see this all the time. So, we have to be really careful not to report it. But this is beautiful because it’s a bit like being an embryologist.
I know nothing about embryology, but I could probably tell you – at a pinch – the difference between a top-grade embryo and a bottom grade one. But the bits in-between are a complete mystery to me; I’ve been to tons of embryology labs they all look at the same to me. That’s subjectivity and that’s where experience comes in. There’s always a certain amount of subjectivity and analysis that we’ve had to apply to these.
And this above is when it becomes subjective. We can see that it’s almost normal but is this [chromosomes 3 and 11] noise? Is this mosaic change (part way change) or is it real? This is when you have to get analysts to go in and look at these things – a bit like grading, you have to go through it.
I used to say it’s the difference between optimists and pessimists; you could see the people in the lab who are optimists and pessimists because some people were thinking it was just a little bit, so ‘I think, that one, I can call euploid’ and vice-versa.
So, what we’ve been trying to do is get away from subjectivity and just use maths and AI to call these.
The software that we had was great and it would call certain things automatically.
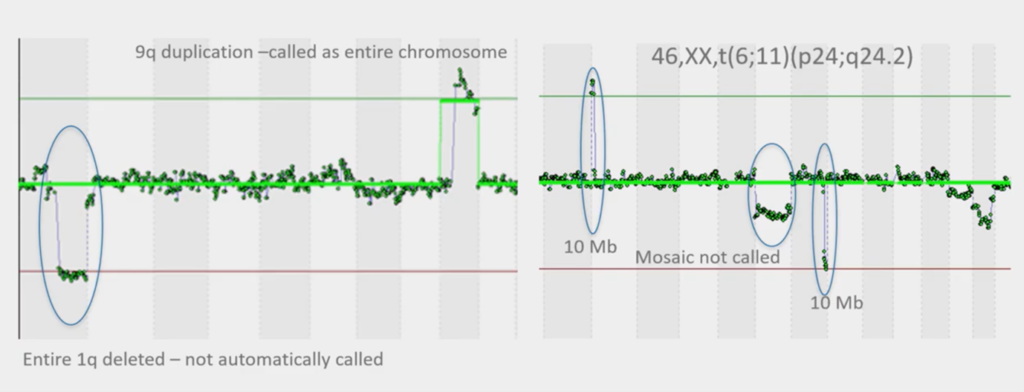
This is how the software used to work and you can see the image on the left, that it’s called part of chromosome nine, but it’s missed part of chromosome one that’s deleted. This is a translocation, so we know it’s a 1;9 and we know it’s real. So, the software wasn’t doing the perfect job.
Again, image on the right, it didn’t call this one because it’s not got the green line here, they didn’t call this one and it hasn’t called this (three circled elements). So, our software that we had wasn’t quite fit for purpose.
What we have now is these super high-tech sequencers. Each sequencer will take our samples of our biopsies and we get tens of millions of what we call ‘DNA sequence reads’ from them and then we used to just plot them into these charts and call the charts.
But now we have an AI model that runs this and automatically generates reports. So, there’s very little of the analyst sitting down and looking at it. It’s a bit like the KIDScores from embryoscopes – we’re trying to take away subjectivity and use maths to give the calling.
It also reduces risk because it actually writes down what then goes into the report. So, your reports look exactly as they always have done but it’s actually a mathematical model that will tell you that it’s euploid, or it’s got 47 chromosomes and gained a chromosome 10, for example. So, we don’t actually have to write things and it reduces their risks of transcription errors.
The other thing we’ve been able to do is change what we call ‘the truth’ (whenever you’re using AI, you have to put a model of what is ‘truth’ and what is ‘not truth’).
This is all really interesting but what is the benefit to you guys? The benefit is that we are beginning to see that it improves accuracy. If it improves accuracy, we call more euploids and we call less aneuploidy, because we can be more certain that something is euploid. Hence, what we’re finding is that you have more embryos to transfer and that’s the main improvement because those things that were difficult to call are more black-and-white now; less grey.
You probably use AI all the time on your iPhone or Amazon Alexa. It’s slightly scary because apparently your Alexa records everything that you say! But it does have its benefits and it requires Big Data to get this to work. That’s why now we have millions of data points – we can just use statistical modelling to call things.
The other thing to say is that have complete version control. We always keep every result, which is also another benefit of AI and keeping everything in the Cloud.
So, we’re using our Big Data in this space, we’re using stats, we’re automating it. The thing that we did differently here, is we thought about our ‘truth’ data. We took a thousand embryo biopsies that resulted in a healthy live birth and we said, ‘actually, that is what defines a euploid’. It’s not just what we’ve seen; it’s the actual outcomes and that’s been a big difference from what we did before. Some poor guys in Houston went through and counted around ten thousand embryos that we use, with our old software and this new software to see how they combined. So, we had things that we knew were euploids, and then we think things that we knew were aneuploids, and things that we knew were mosaic and that’s how we developed our model.
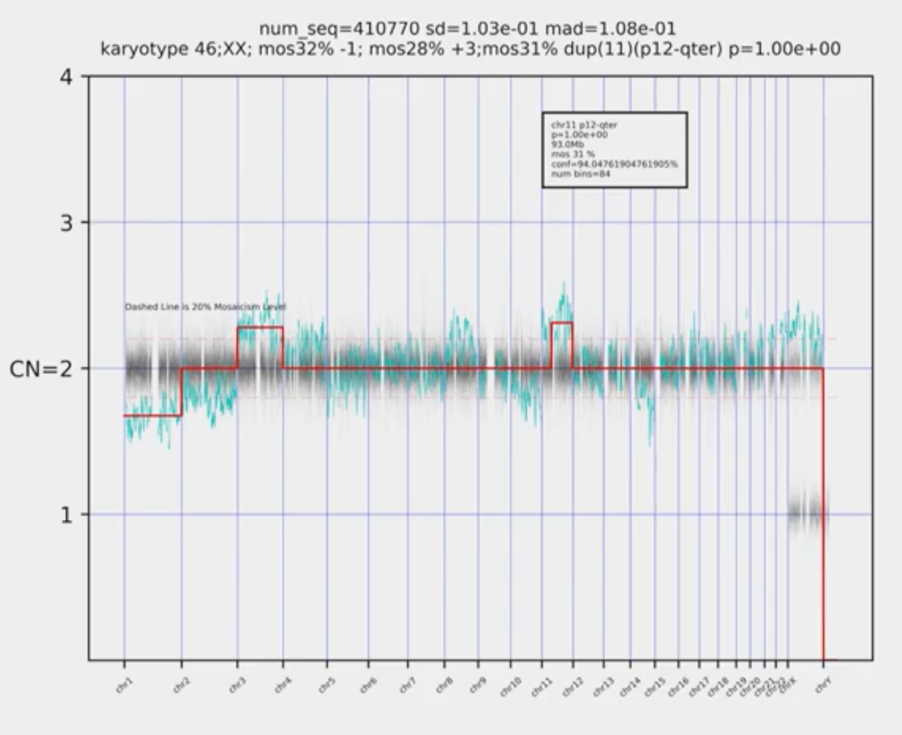
This is what it does now. Without getting too tech-y, this horrible picture just uses mathematics. So, it just looks and counts, and it produces the karyotype straight away. Your reports look identical, it will just say ‘euploid’ or it’ll say ‘aneuploid’ and it’ll color-coded. It looks absolutely identical but there’s a whole lot of science behind in there.
So, one of the things that is done is it’s given us this whole bunch of information about mosaicism because it’s given us a kind of sensitivity that we didn’t have before. Alan Handyside suggests we’ve always been transferring mosaic embryos. Who knows? Louise Brown could have been mosaic; we don’t know. Now we can see it, we can’t un-know it. We know that a percentage of embryos are mosaic but that’s always been the case – we’re not doing anything different.
So, what is a mosaic embryo?
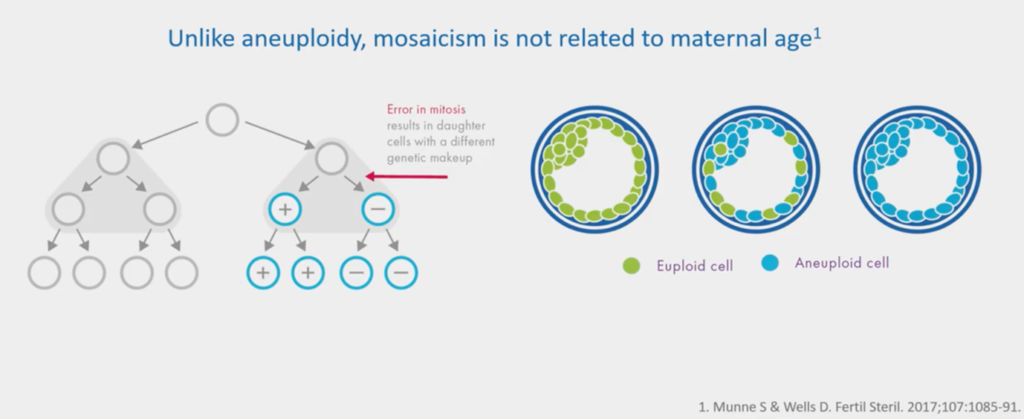
This green image is a euploid. Every cell has 46 chromosomes: it’s normal. This blue image is a clonal aneuploid; it has 47 chromosomes – a gain of chromosome 10 – every one of these cells will have that gain of chromosome 10.
A mosaic is where you have a mixture of two or more cell lines, so you have euploids and aneuploidies mixed in. There’s quite good evidence that quite a lot of us have low-level mosaicism; as we do millions of these genome studies, you do start looking at people and wondering… but that’s it, that’s the science nerd part!
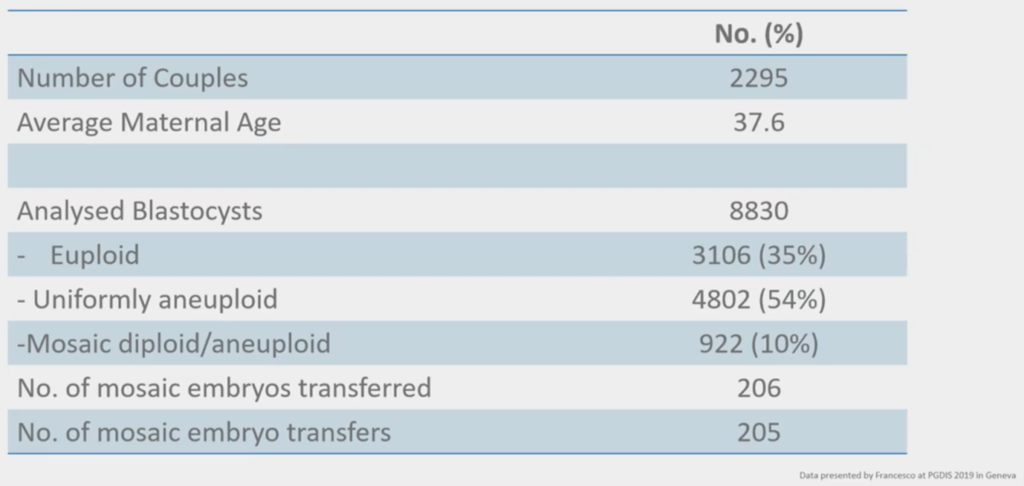
We were in Geneva and everybody in our PGT ‘geek meeting’ was there and we were looking at mosaicism and this above was a really nice study done by some people that we have collaborated with in the past; GENOMA in Rome. They had a study where they’ve taken two thousand couples and they looked for euploid / aneuploid and they looked for mosaicism.
When you do something and you report it, it’s Data. When somebody else a.) does it, b.) reports it, c.) has the same findings, and d.) you can reproduce those findings in different places, it becomes Science. And what is happening is, we’ve started off with Data on mosaicism; now people are reporting the same things from different labs in different places and reporting the same data. So, their 10% is spot on with where we are with our 10% on mosaicism. That means one in ten embryos and their cohorts will mosaic.
What they did is they transferred these mosaic embryos and looked at the outcomes and this is just the new field of transferring mosaic embryos.
I know there have been some mosaic embryo transfers in the UK and I know at least one baby that’s been born after a mosaic transfer.
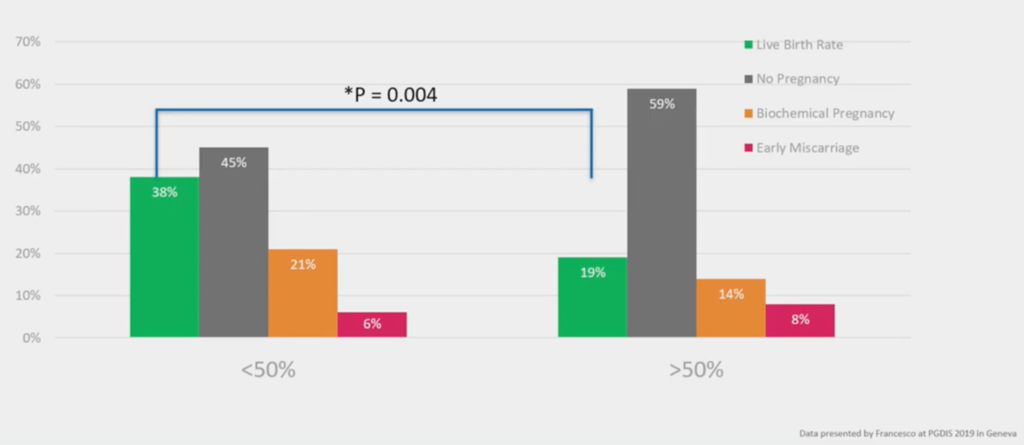
They at GENOMA, have divided up their mosaicism to ‘Low Level’ and ‘High Level’. At ‘Low Level’, less than 50% of the cells have aneuploidy; at ‘High Level’, more than 50% at the cells have aneuploidy. And you see a reduction in live birth rate biochemicals and an increase in miscarriage with more mosaicism. It’s an interesting functional evaluation of the genetics; the genetics says, ‘this biopsy has more cells that have the wrong number of chromosomes, they have a worse outcome’.
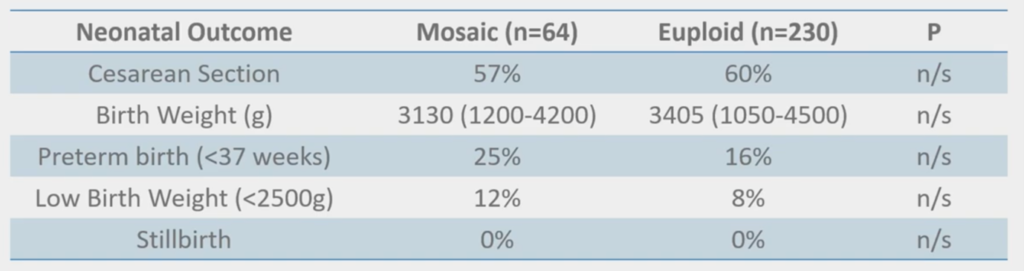
And, interestingly, none of this is ‘significant’ but we’re beginning to see some slight trends; the mosaics having things like low birth weight and preterm birth. But that’s what you would expect from when you do CVS because you see mosaics in CVS, and they have slightly poorer outcomes as well. They can still result in a healthy live birth but it’s always a little bit more of a difficult conversation. Fortunately, we have genetic counselors and things like that, so I don’t have to have that conversation.
What we did as well, in our conference, was combined all the data that’s been published so far (which is a measly 372 cases – way less than 1% of the two million IVF cycles a year) that has actually been done with transfer and outcomes.
If you look at ongoing pregnancy births of mosaics versus euploids, they don’t do as well, but they can still result in a healthy live birth.
So, it’s a really interesting area that will keep me in a job and keep us discussing genetics for a long time into the future.
Here, if you want it (and we don’t force you), you can define whether you want mosaicism calling or not. We recommend it because the science is beginning to show it, but we will report whether it’s normal, a Low-Level mosaic, a High-Level mosaic, or every cell is aneuploid. The reason why we split these up is because the Low Levels are now beginning to show that they do better than the High Levels, so we’re trying to give you that information.
And where these might have just been called ‘aneuploid’ in the past, we’re trying to give you the best chance of finding something to transfer.
There are a whole bunch of benefits (which is a talk in itself) of PGT-A. So, if you can find a euploid (and that’s always the problem with advanced maternal age because there’s very few) you can do as well as a younger mother. Implantation success rates improve, the data is really, clear that you get a reduction in miscarriage, and it enables better ongoing pregnancy rates.
However, it doesn’t improve embryos and if you implanted every embryo in sequence you would have the same outcome as if you did PGT-A.
About the Presenter: Tony Gordon
Dr Gordon is a PhD molecular cytogeneticist with over 20 years’ experience in molecular diagnostics.
He is currently the Direct of Clinical Operations for CooperGenomics UK labs, and is leading the CooperGenomics global business development – outside the US. Dr Gordon is also a UK State Registered Clinical Scientist and is a Fellow of the Royal Society of Biology.
Find out more about Tony Gordon PhD.
Find out more:
The following are mentioned throughout the text above and/or are particularly relevant to it. To find out more about each item, please click the link.